
Why Can Two Laboratories Report Different Purity Percentages for the Same Peptide Sample?
By Kinetix Research Editorial Team · Published October 4, 2026 · Updated October 14, 2026 · 2 min read
Quick Answer
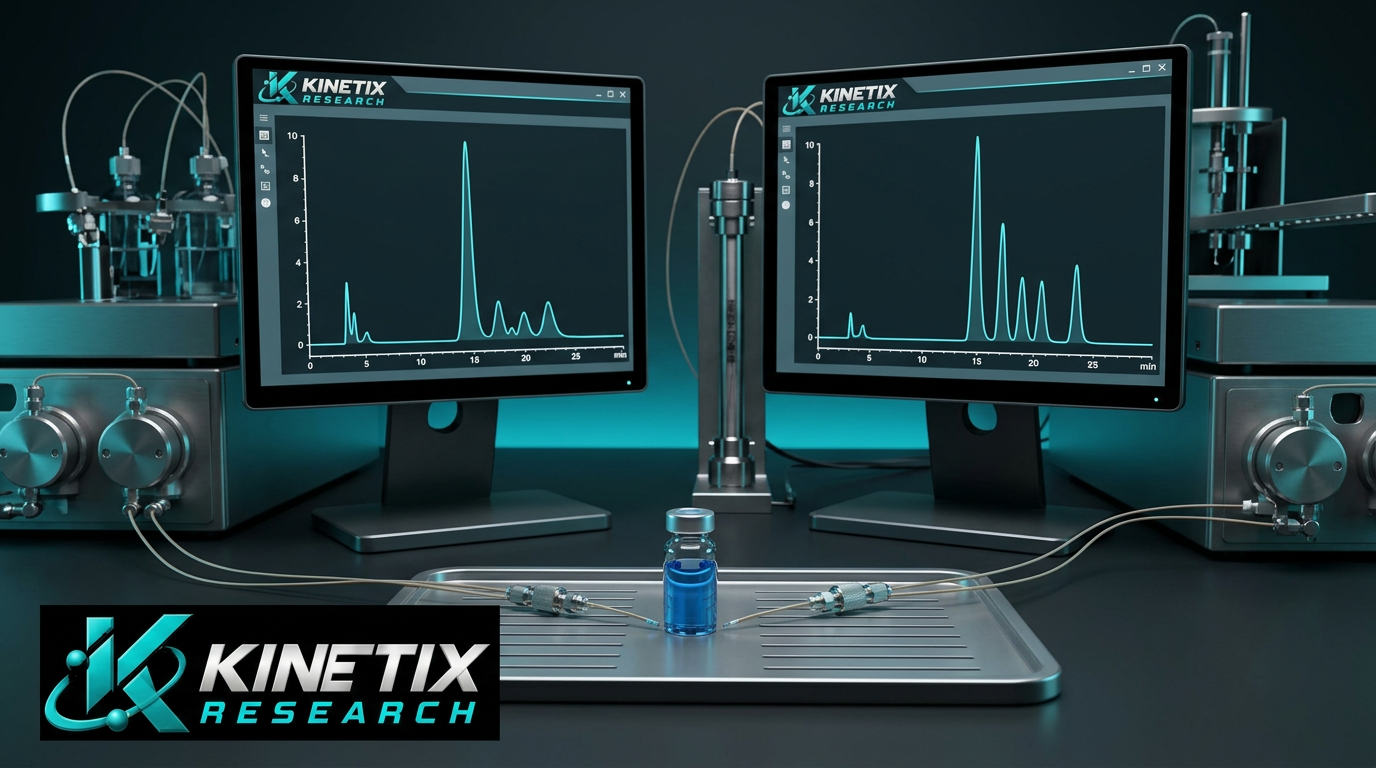
Purity percentages can differ because laboratories use different separation methods, detector settings, sample preparation or peak-integration rules. Co-elution, thresholds and ordinary measurement variability also affect the result. Differences do not automatically mean one laboratory is wrong; researchers must compare methods, raw data and sample history before treating the values as equivalent or contradictory.
Key Takeaways
- A purity value belongs to a method, not just a vial.
- Better separation may reveal impurities previously hidden in the main peak.
- Integration settings determine which signals enter an area calculation.
- Content quantification and chromatographic purity are different measurands.
Are the laboratories measuring the same thing?
First compare the definition of purity. An HPLC area percentage, a calibrated peptide assay and a mass-fraction estimate are not interchangeable. Even two results both called HPLC purity may come from procedures with different resolving power and detector response. A number without its method is an incomplete description of the measurement.
For illustration, one method could merge a minor component into the main peak while another separates it. The second result may assign less relative area to the intended peptide, even though the starting material was the same. This example explains a mechanism; it does not predict the size or direction of every interlaboratory difference.
Which analytical choices can change a purity percentage?
| Variable | Potential effect |
|---|---|
| Column chemistry and gradient | Change separation and whether neighboring species co-elute. |
| Detection wavelength | Change the relative detector response of components. |
| Sample solvent and concentration | Influence recovery, peak shape or detector performance. |
| Integration threshold and baseline | Change which small peaks are included and how areas are assigned. |
| Preparation and elapsed time | Introduce differences from handling, degradation or incomplete dissolution. |
Validation examines characteristics such as specificity and precision for an intended use. A validated method still has uncertainty. Small numerical differences may be consistent with its repeatability, while a larger difference may justify investigating method selectivity, preparation or data processing.
Was the sample truly the same when tested?
Two aliquots from one lot may have different histories after shipment, storage or preparation. A heterogeneous material may also be sampled unevenly. Before assigning a disagreement to instrumentation, researchers should document lot identity, aliquoting, handling conditions and the interval between tests.
Published interlaboratory work on oxytocin compares peptide quantification procedures and their reproducibility. That is useful evidence that measurement definition matters, but quantification variability should not be presented as if it were a direct experiment on every HPLC purity percentage. The distinction between amount and relative peak area remains important.
How should differing reports be compared?
- Confirm the same lot, material definition and type of reported percentage.
- Compare column, gradient, detector settings and sample preparation.
- Review chromatograms, integration rules and evidence of co-elution.
- Check replicate results and the method's documented precision.
- Use a common reference or harmonized method when a direct comparison is required.
There is no scientifically justified shortcut of always accepting the higher or lower result. The defensible approach is to decide which method is fit for the question, understand the discrepancy and keep the interpretation within the evidence. Orthogonal testing may help resolve a specific ambiguity.
Frequently asked questions
Does a lower purity value mean the sample degraded?
Not necessarily. Different separation or integration can produce a lower value; handling-related change is only one possible explanation.
Should results be averaged across different methods?
Not automatically. An average may hide different measurement definitions or systematic biases rather than produce a more meaningful result.
Can both laboratory reports be technically valid?
Yes, within their respective methods and limitations. Direct comparability still needs to be demonstrated.
References
- ICH Q2(R2): Validation of Analytical Procedures, International Council for Harmonisation
- Survey of Peptide Quantification Methods and Comparison of Their Reproducibility: A Case Study Using Oxytocin, Journal of Pharmaceutical and Biomedical Analysis, 2018
Research Disclaimer. Kinetix Research content is for educational and informational purposes only. It is not medical advice and does not describe the safety or effectiveness of any product for human use. All Kinetix products are for research use only. See our scientific disclaimer and editorial policy.
Related research
Analytical Testing
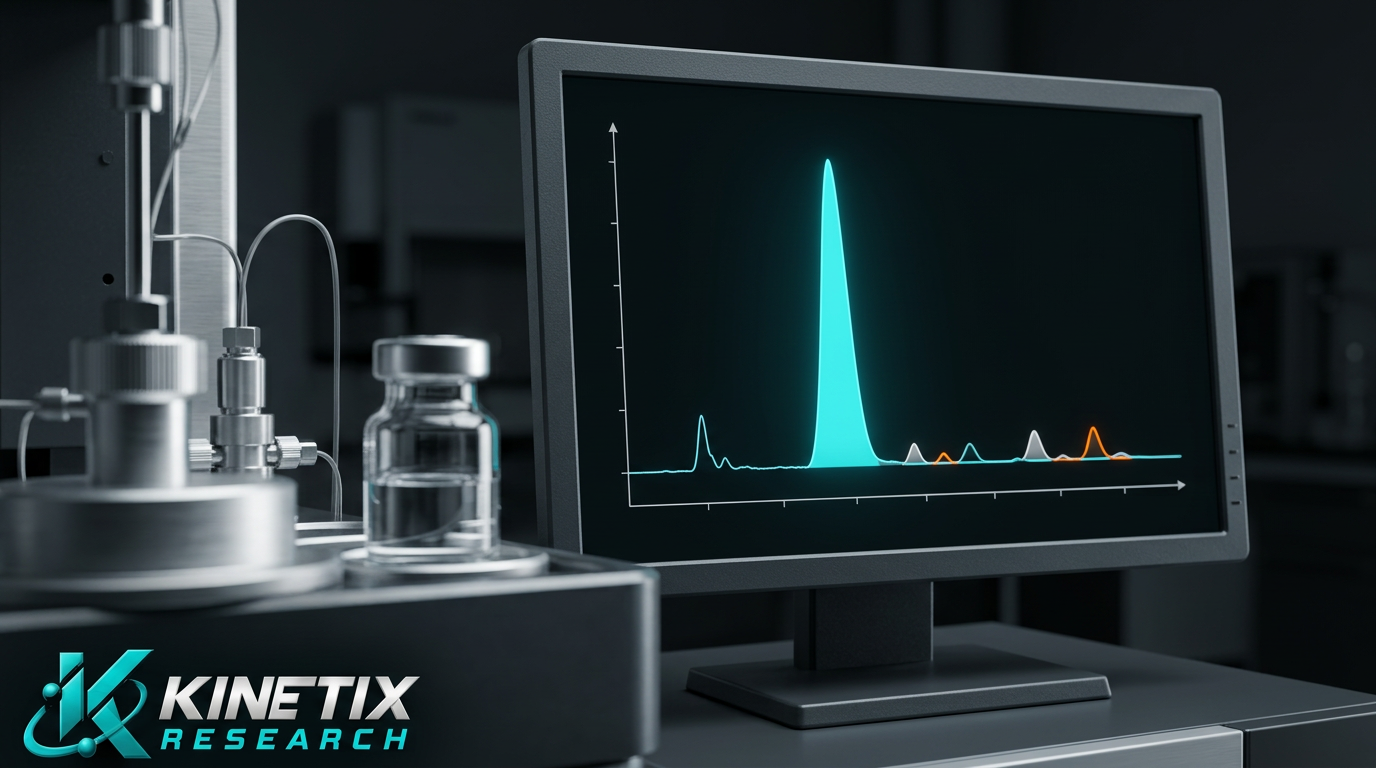
If a Peptide Is Labeled 99% Pure, What Exactly Makes Up the Remaining 1%?
Understand what the remaining 1% of an HPLC purity result represents, which impurities may contribute and why it is not a complete mass balance.
Analytical Testing
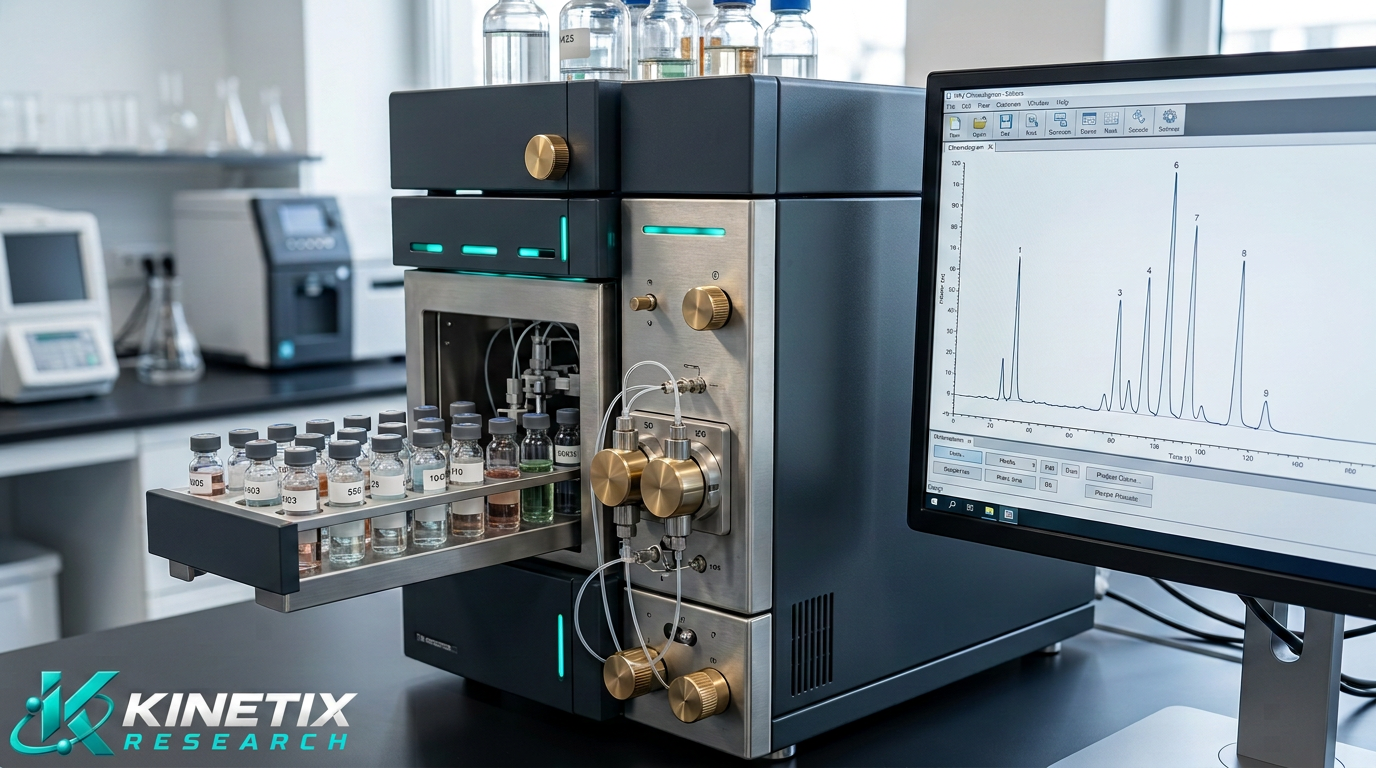
What Is HPLC Testing? A Plain-Language Guide for Peptide Research
How high-performance liquid chromatography separates a sample, what a chromatogram shows, and where its limits are.
Analytical Testing
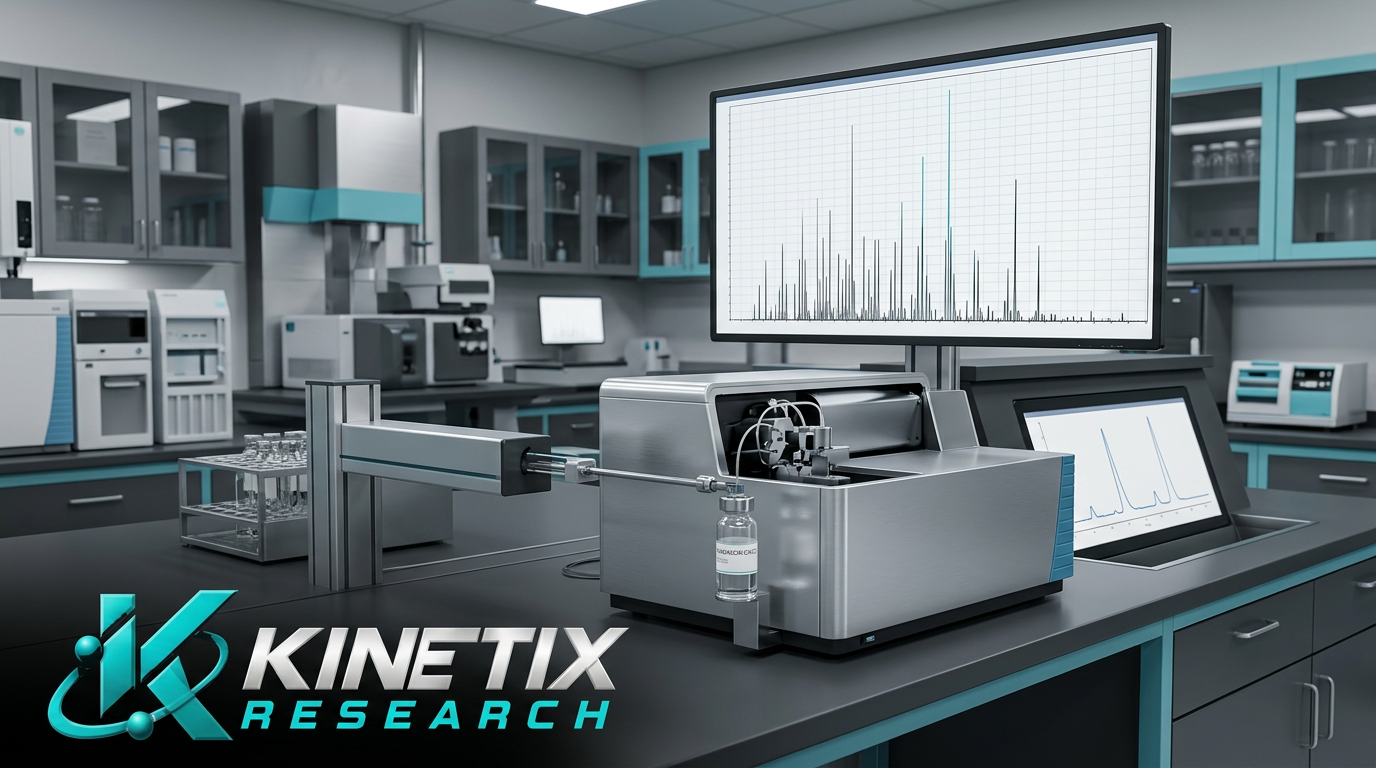
Can Mass Spectrometry Identify a Peptide Without Proving That It Is Pure?
Learn what intact mass and tandem mass spectrometry can establish about peptide identity, and why identification is not proof of sample purity.
Contact the Kinetix Team
Let's Talk Science.
Have a question about an article or a topic you'd like us to explore? Say Hi to the Kinetix Team.
Stay Updated on Research
Receive research insights, scientific updates, and educational resources from Kinetix Research.